Additional treatment
Diagnostics, medical assessment, nursing observations, imaging and follow-up can consume additional resources after an event.
Controlling data:internal cost per event / severityThe economic question is bigger than device price. Relevant exposures include additional treatment and observation, staff time, length of stay, occupied bed capacity, documentation, potential liability claims and the quality of risk evidence presented to insurers.
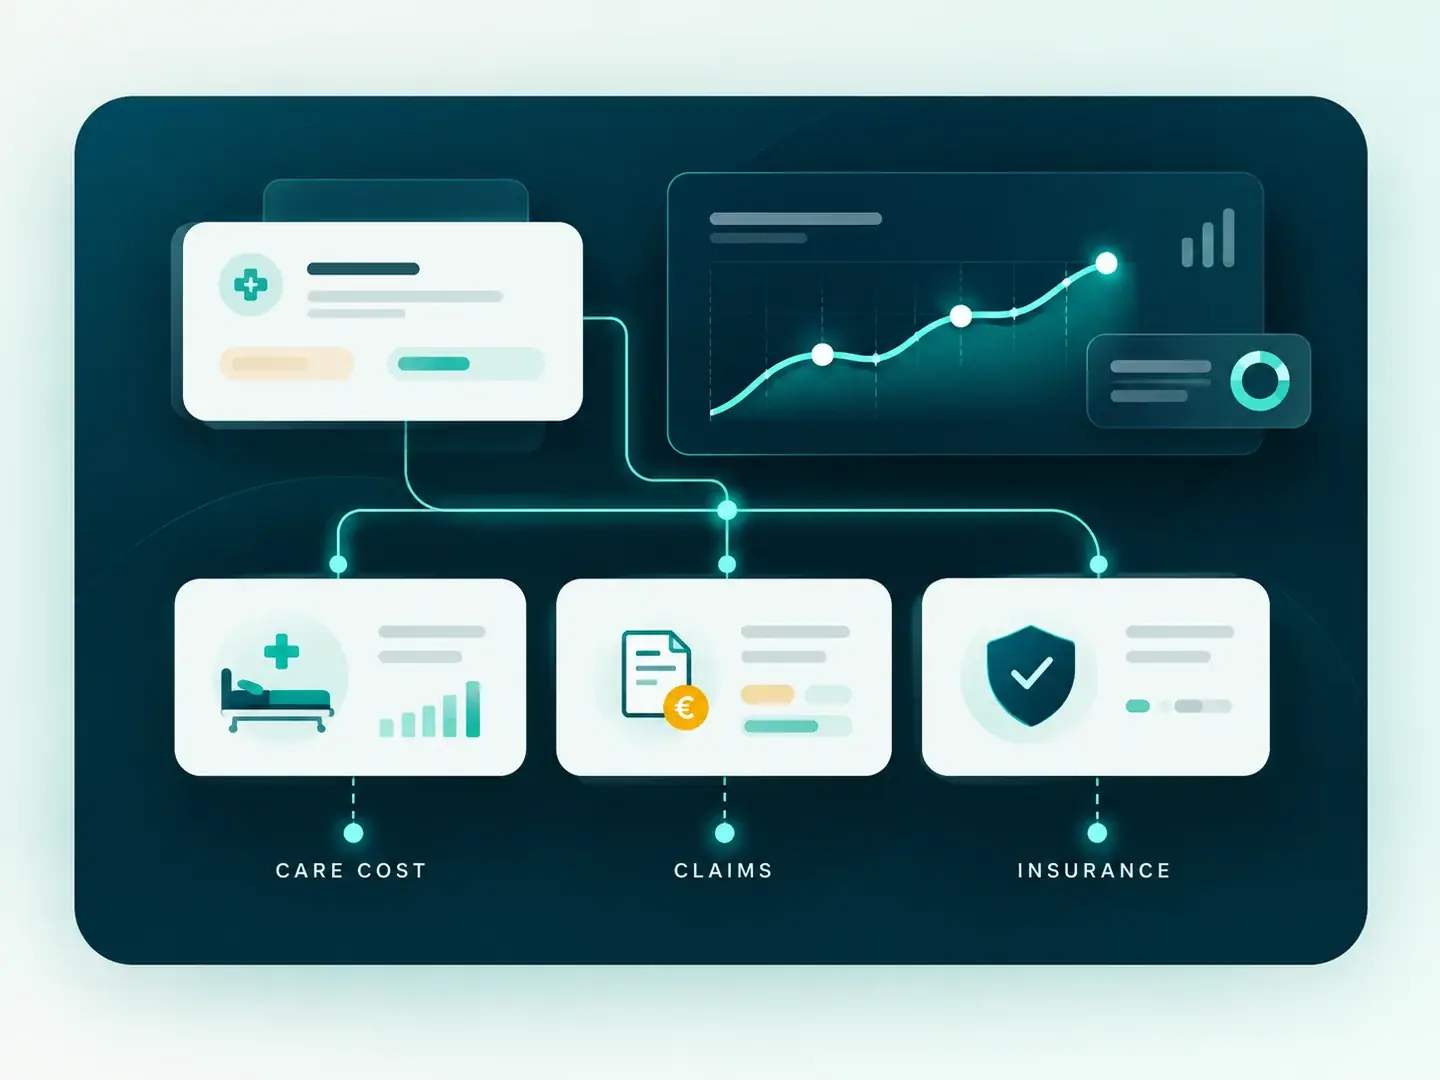
Each block should be populated with the hospital's own controlling, quality and insurance data. Under German DRG reimbursement, avoided resource use does not automatically translate one-for-one into realised cash savings.
Diagnostics, medical assessment, nursing observations, imaging and follow-up can consume additional resources after an event.
Controlling data:internal cost per event / severityObservation, documentation, handover, incident reporting and coordination consume nursing, medical and quality-management time.
Controlling data:minutes per event × loaded hourly costIf an event extends treatment, the impact may include both additional resource use and bed capacity that cannot be used elsewhere.
Controlling data:additional days × internal bed-day valueInternal investigation, patient communication, record review, legal advice and notifications create cost even when litigation never follows.
Risk data:case count, handling time, retention/deductiblePatient-safety incidents can lead to liability claims and legal expense. Frequency, severity, documentation and evidence of the actual response process matter.
Risk data:5-year claims history, reserves, legal costBetter risk evidence can support broker and underwriter discussions. Whether premium, retention, coverage or terms improve is determined by the actual insurance market — not by WeTraQ.
Insurance data:premium, retention, loss ratio, renewal termsThe scenario percentage is explicitly not a WeTraQ efficacy claim. Use it to test what measured improvement would be required for a pilot or rollout to carry itself economically.
Insurers and risk managers care about loss history, process quality, documented prevention and response performance. A digital event and response record can provide additional evidence for that discussion.
Do not measure technical availability alone. Capture the variables that controlling and risk management will need afterwards.
Baseline versus pilot period, separated by ward and cohort.
Which events actually create additional care?
Nursing, medical, documentation and quality-management time.
From alert to acknowledgement and handling.
Only where clinically and methodologically attributable.
Link long-term results with risk-management and insurance data.
A current German hospital economics analysis identifies injurious falls as an economically relevant nurse-sensitive indicator, while noting the lack of direct German/European hospital fall-cost studies and the importance of DRG mechanics.
International hospital evidence · In-hospital fallsObservational evidence associates in-hospital falls with longer stays and additional cost. These are not German unit-cost values, so they are not preloaded into the calculator.
Healthcare risk & insurance · Marsh GermanyRisk management, patient safety, claims cost, liability exposure and insurance terms are treated as linked components of total-cost-of-risk management.
WeTraQ product informationWeTraQ describes auditable incident logs, response times and insurance-ready reporting. In Germany we present this as underwriting/risk evidence, not a guaranteed premium saving.
That requires baseline data from quality, controlling and — where available — risk management / insurance.